
MaryAnn gave some excellent analysis in wondering if LDS population was a good predictor of Trump support in Utah. It turns out that she was right–LDS population by county was statistically insignificant in the analysis. The best predictors of a Trump supporter were % Registered Republicans, and % Rural.
This is going to be very math-y explanation, so I’ll try to explain this best I can. The following analysis was done using Excel and SPSS using MaryAnn’s data set given in the previous post. Last Lemming posted a few correlation coefficients comparing Rural vs Mormon. A correlation coefficient tells you how well correlated the 2 variables are with each other. Looking at scatterplots and overall correlation coefficients, you can see that both Rural and Republican scatterplots have a much steeper line that % LDS. Typically in my statistics classes, I tell people that a correlation coefficient between 0.3 and .7 is a moderate correlation. All 3 pairs of variables show moderate correlations as shown below.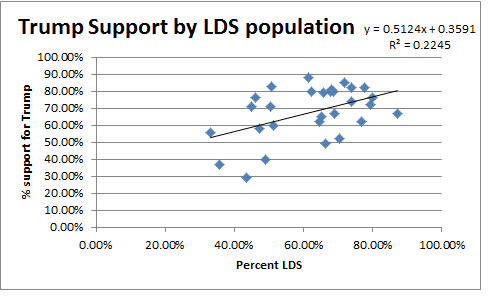

| Trump-LDS | Trump-Rural | Trump-Repub |
| 0.473784379 | 0.661807356 | 0.689037815 |
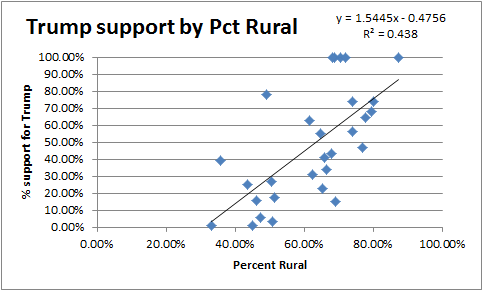
Visually, you can best see this with a scatterplots shown to the right. Notice that the Rural and Republican plots are far steeper, while the Republican plot shows the dots are much tighter than either Rural or LDS plots. There appears to be a lot more variation in both the LDS and Rural plots as evidenced by the further distance of the dots from each other.
If we were to draw a line that best fits the data, this is called a regression line. How good is the line? That’s given by the r-squared value. Just take the correlation coefficient (r) and raise it to the 2nd power to see how good your model is. As you can see from the 3 graphs, the r^2 for LDS is 0.22, for Rural it is 0.438 republican it is 0.475. This basically says that if the only thing you consider is LDS population by county, 22% of the variation is explained by LDS population (and 78% is other factors). You can make similar deductions from the other 2 graphs. The closer your r^2 value is to 100%, the better your model is. So we can see that Rural and Republican models explain Trump support better than LDS population does.
So how do you find the best predictors of Trump support in Utah? Excel just won’t do. You need a better statistical package. So, I ran the analysis again using all 3 variables as predictors of Trump support. When I do that, LDS support falls out of the model completely. Percent Rural and Percent Registered Republican are the only statistically significant predictors of support for Trump as shown in the table below.
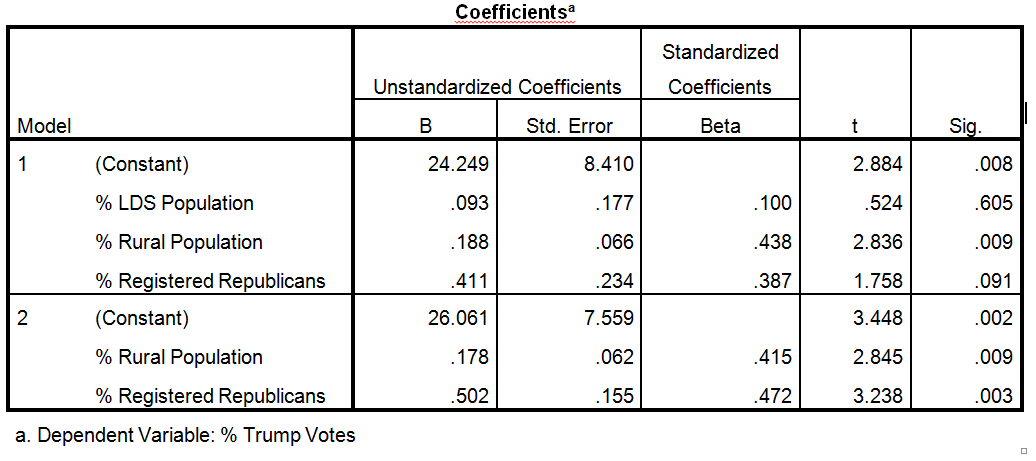
*Note-Model 1 includes % LDS (statistically not significant) in the model, while Model 2 only includes % Rural and % Republican.
To explain the table, basically we add all 3 variables (% LDS, % Rural, and % Registered Republicans) to start the model and see which variables are most significant. If a variable has a significance level less than .05 (last column) then we say it is statistically significant. If a variable is >.05, then we remove the least significant variable (the one with the highest value–in this case % LDS is .605) from the model and re-run the analysis until all variables are less than .05.
So the first time we ran the analysis, it showed that LDS population was the least significant variable (.605), so it was removed from model 1. Then the regression was run with just % Rural and % Republican. You can see that both variables in model 2 are HIGHLY significant (.009 and .003.) These 2 variables are much better predictors of whether a person would vote for Trump. Basically, if you were to run an equation to predict Trump support in Utah counties, it would look like this:
trump support = 0.472(% republican) + 0.415(% rural)
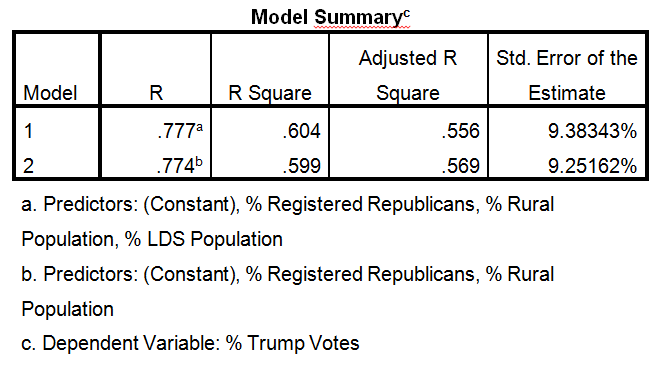
Now, how good of a model is the equation above? It’s got an r^2 value better than any of the Excel graphs above (0.599) which means that 40% of Trump’s support in Utah is explained by factors other than our model of just 3 variables.
Now, I suppose it could be argued that LDS=Rural and LDS=Republican (at least that’s what it seems like at church.) So I ran a few correlation coefficients to see if these were correlated. To my surprise, there was extremely weak correlation between % LDS and % Rural (0.21) but there was a very strong correlation of LDS and registered republicans (0.72). That can’t be denied, and it probably explains that it is the registered republicans who are making all the political statements at church. They’re the proud and loud Republicans at church.
| LDS-Repub | LDS Rural |
| 0.72683678 | 0.211068885 |
Still, I don’t know the overall percentage of LDS Registered Republicans in Utah, but if we take the mean of all counties (probably not a super accurate number), it seems the “average” registered LDS republicans by county is 54.72%, meaning 45.28% are either unaffiliated or registered democrats. This seems to show why % LDS wasn’t a very good predictor of Trump support.
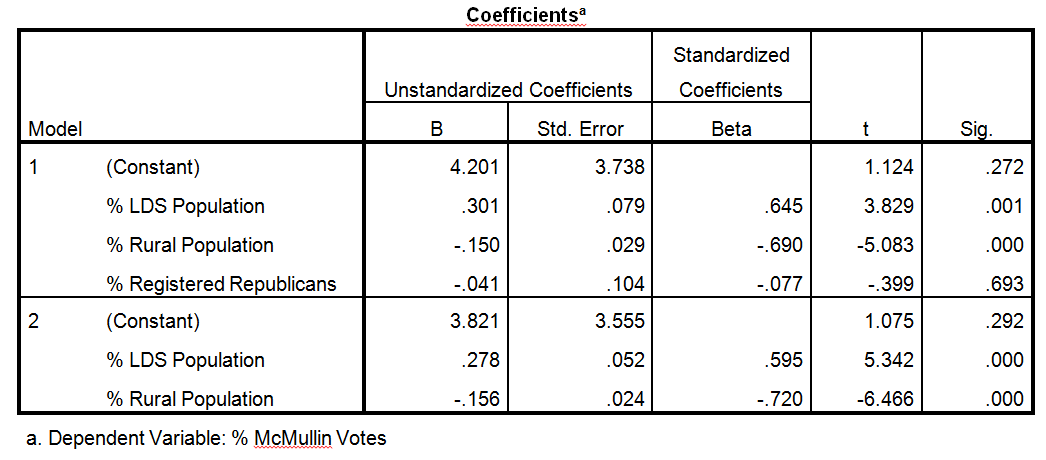
MaryAnn was nice enough to give me an expanded data set for McMullin and Clinton support. That gave some interesting results as well. Using the same methods as described above, I did a regression analysis of McMullin support in Utah. As shown in this table, both % LDS and % Rural were significant factors to predict McMullin support. % LDS population was highly significant (.000). The Betas give a measure of the strength of support. McMullin had positive support from the LDS population (.595), but have negative support from Rural (-.720). So it seems that Rural counties voted overwhelmingly for Trump, and against McMullin. The equation would be this:
McMullin support = 0.595(%LDS) – .720(%Rural)
In other words, McMullin’s LDS support was overwhelmed by Rural voters who seemed to choose Trump over McMullin. (Whether someone was a Registered Republican was not statistically significant (pvalue 0.693). (The r^2 value for McMullin’s model is 0.668.) I also ran the model to see how unaffiliated voters went for McMullin and it was not statistically significant (pvalue 0.875)
Now let’s do that for Clinton.
 The takeaway from this table is that support from Rural voters was not statistically significant for Clinton. LDS voters (beta -0.455) and Registered Republicans (beta -0.452) were nearly identical in their dislike for Clinton and were highly statistically significant.
*Another way to think of this is that non-LDS probably voted more for Clinton.
*The r^2 for this model is 0.712, meaning of the 3 models, this was the best predictor–in this case of negative support for Hillary Clinton.
*Unaffiliated votes didn’t vote in significant numbers for Clinton either (pvalue 0.684–not shown)

So where did Clinton get her support you may ask? Democrats overwhelmingly voted for her. Noteworthy also is the fact that % LDS and % Rural were also significant, just in opposite directions. If we start with a baseline of 36% of support, then we can add democrat support (beta 0.456) and subtract off % LDS population (beta -0.441) and % rural (beta -.222).
Clinton support = 0.456(% democrat) – 0.441(%LDS) – 0.222(%rural)
If you want to see the data set I used (combination of Mary Ann and mine), see election-analysis-utah-counties
Finally, I came across a recording from a BYU-Idaho professor who analyzed election results and noted that while the guys at fivethirtyeight.com did get the polls wrong, the results were within the margin of error. Problem was the Electoral College magnified the mistakes, tipping the election to Trump. He specifically highlights the states of Michigan, Utah, and Idaho where there were some interesting results. If you’d like to listen, turn on your speakers: https://byui.adobeconnect.com/_a727341645/p6vtkl65hek/?launcher=false&fcsContent=true&pbMode=normal (It’s a different discussion than what Mary Ann and I did, but still interesting if you’re a statistics nerd like me.) The professor notes that it looks like a lot of McMullin voters changed their mind and voted for Trump in the booth.
I know that was a technical discussion but it does seem to imply that McMullin voters were significantly LDS, while Trump voters didn’t get statistically significant LDS Support, and Clinton had negative support from high LDS population counties. Are you surprised by any of these results?

Thanks for the analysis. I’m not surprised — what this seems to show some that Utah Mormons followed the same general pattern of non-Mormons in largely-rural states. There seems to be no Mormon ideology at play in Utah voters’s decision for Trump or against Clinton. Maybe in voting, Utah Mormons are just Americans.
Ji that isn’t how I interpret this. While LDS dominated counties showed no heightened support for Trump once you accounted for R registration and ruralness, they DID show significantly higher levels of antipathy towards Clinton. So there is something about being in Mormon dominated areas beyond just being Republican domimated that led to decreased support for Clinton.
Also, one thing that many of us found son depressing is that there wasn’t a negative association between LDS concentration Trump support! That says something to. In this model the coefficient on LDS is positive just not statistically significant. If done at a finer grained level (ie individual or precinct) with its much bigger N the.positive association has a good chance of being statistically significant.
One thing I would like to see would be interaction terms ie do areas that are Republican AND Mormon have a compounding effect on support
Keep in mind that this county level analysis which is fine but we shouldn’t draw conclusions at the individual level per se. Lots of funky stuff can go on between levels.
There was a lot of Clinton antipathy in a lot of places outside Utah with no significant Mormon populations. You cannot correlate Clinton antipathy with Mormon ideology.
And please don’t be depressed if some (or even many) fellow Saints voted for Trump. Be thankful that each citizen (Saint and otherwise) was able to vote in a free and honest election. Bemoan the major party nominees if you must, but don’t bemoan that some Saints might have voted for Trump.
I think voters (Saint and otherwise) had valid reasons for voting against Trump and also for voting against Clinton. But in an election, we have to vote for someone. In rural America, most voters (Saint and otherwise) voted for Trump — in this, they followed trends among the general population. In other words, they voted like their fellow Americans.
“So there is something about being in Mormon dominated areas beyond just being Republican domimated that led to decreased support for Clinton.” I think we need to chalk that one up to the relentlessly negative coverage of Clinton by right-leaning news sources like Fox News for decades. She was damaged goods to anyone whose main news source (which includes family discussions) was right-leaning, but she wasn’t seen as nearly so flawed to those who digest their news from a variety of sources nor to those who read left-leaning sources. Utah is mainly a Fox News state. The Deseret News coming out against Trump also spoke volumes by not coming out for Clinton. To some that may have been a dog whistle.
I do think it is important to bring into the conversation that nationally(according to exit polls referenced by Jana) that 61% of members voted Trump. I find that amazing that they beat the average American by a huge margin. After all, she won the national vote by about 2 million. Just my opinion, but the membership does not have any place to say they have the high moral ground on major issues of importance from this point forward, if they ever did.
Angela and JI,
In theory the Clinton antipathy and rightwing attacks you are citing should be absorbed by the % Republican measure. Since it is controlled for you have to me up with a unique reason why LDS dominated areas have even more antipathy for Clinton beyond broad right wing republican antipathy. It could be that Mormons are more conservative than your average republican and LDS becomes a proxy for conservativeness.
Angela, your BCC post provides another theory about what might contribute to it as well.
Thsee models in the article are very simple so they can’t really tease out such things. They do provide evidence though that LDSness has some unique attributes to further explore.
A white nationalist and Trump supporter robo-called UT voters saying, among other things,
that McMullin was a “closet homosexual.” I wonder if those robocalls decreased support for McMullin.
Lois has a point. RAH also points out the LDS sexism factor: LDS women who feel they benefit from patriarchy (e.g. financially supported by a dying single breadwinner model) are more likely to vote Republican since they get less out of equal pay and anti-discrimination laws. And the other factor could be lack of racial diversity in Utah. It’s not that Utahns are racist per se. I’d like to think they are not. But it may be that those concerns raised by the white supremacy rhetoric in Trump’s rallies are less immediate than they are to folks who live in more racially diverse areas.
What was not considered in either analysis was the education level of the voters. One would expect, as shown in the national polls, that lower education levels would correlate to votes for Trump. This might explain the rural votes as well.