
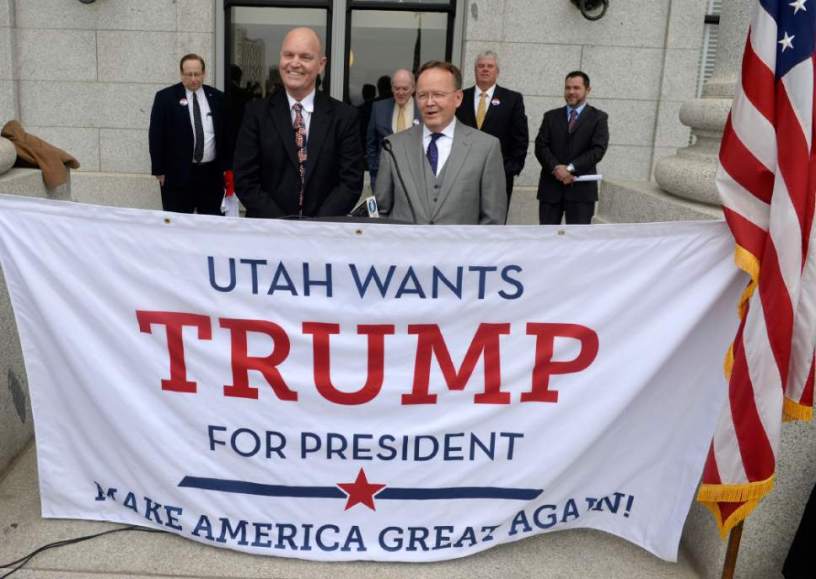
Utah’s support of Donald Trump in the recent U.S. Presidential election has caused some personal introspection. Trump winning Utah wasn’t unexpected, but the sheer number of votes he garnered was surprising given the rocky public relationship between him and Mormons (Utah is about 63% Mormon). People have attributed Trump’s support to a number of factors: rural voters hoping to stick it to urban “elites,” rising trends of nationalism and anti-globalism, entrenched racism, misogyny, bigotry, and more. Some have specifically blamed Mormon patriarchal culture for pushing Utah women to reject a female candidate.
Mormon moral outrage at Trump’s pursuit of the presidency was unusual, to say the least. Early in the campaign, church leadership issued a rare public response to his suggestion of barring Muslims from entering the United States. When Trump became the Republican front-runner, a well-respected Mormon politician and 2012 U.S. presidential Republican nominee gave a very public speech denouncing him as “a fraud.”[1] At the beginning of October the editorial board of the church-owned Deseret News published an op-ed calling for Donald Trump to step down, arguing “The belief that the party and the platform matter more than the character of the candidate ignores the wisdom of the ages that, ‘when the wicked beareth rule, the people mourn.'” A Mormon third-party candidate even looked poised to take Utah’s electoral votes away from Trump a couple weeks before election day.
Trump’s unexpected level of support in my home state has continued to bother me, so I decided to look at the numbers to determine any influential factors. I compared Trump support in each county to the most likely measurable factors I could think: percent Mormon population, percent rural population, and percent registered Republicans.
Mormon Population

As I said before, Utah is about 63% Mormon. A 2014 Salt Lake Tribune article lists estimated percent Mormon population per county. The graph shows these figures (red line) with Trump support (blue line) among individual counties per Utah’s official election results website.[2] The counties are arranged by Mormon population from lowest to highest for visual ease. While there is a general uptick in Trump support (blue line) going towards more Mormon-dominated communities, it doesn’t look like the two are tightly connected.
Rural Population
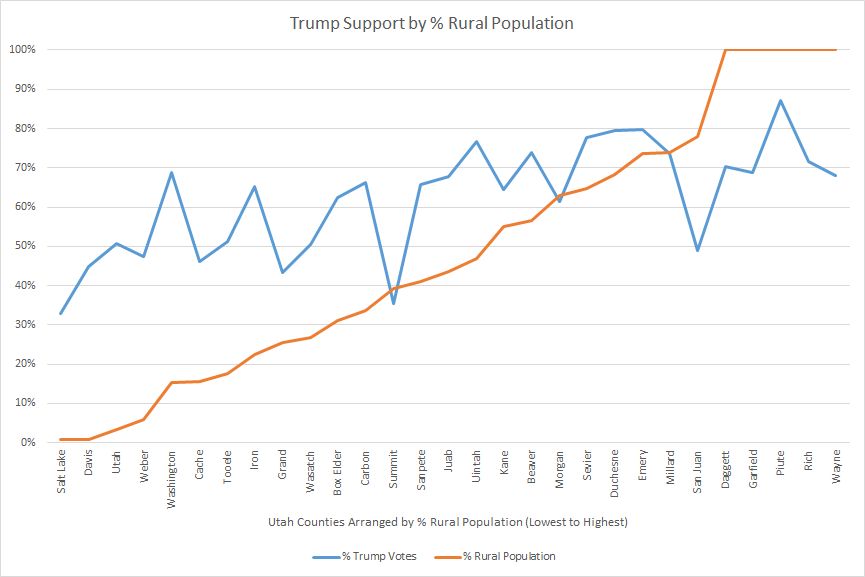
The U.S. Census Bureau website has data for urban versus rural populations per county from the 2010 federal census. The graph shows percent rural population in Utah counties (red line), again arranged from lowest to highest, and corresponding Trump support (blue line). While there is a slightly steeper general trend in Trump support from urban to rural areas, the pattern is inconsistent among individual counties.
Registered Republicans
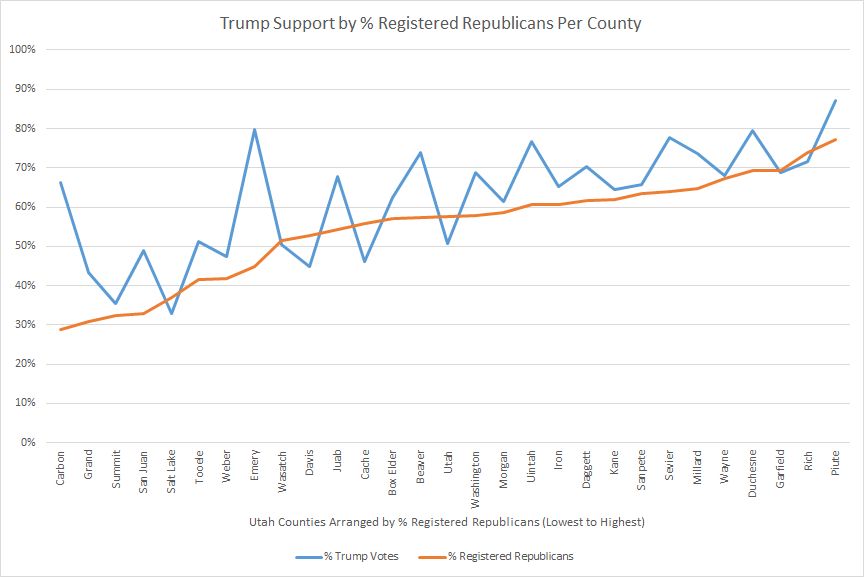
The Utah government website has numbers available on registered voters and party affiliations per county. The graph shows percent registered Republicans per county (red line) from lowest to highest and corresponding Trump support (blue line). I wasn’t expecting much with this data since it has two major problems:
- Not all registered voters show up on Election Day. The election results website shows a total of 1,089,641 votes for the 10 named President/VP candidates on the ballot (doesn’t include write-ins). This turnout represents about 68.9% of total registered voters in the state.
- Over a third of Utah registered voters (39.8%) are unaffiliated with any major political party.
In spite of these problems, a clear pattern emerged. Trump support seems to roughly correlate with the percent of registered Republicans in any given county. Apparently it isn’t coincidental that the percent of Trump votes in Utah (45.4%) is close to the percent of registered Republicans statewide (46.2%).[3]
My Takeaway
Obviously not all registered Republicans voted for Trump (hello, Exhibit A), but his support seems to roughly correlate with political affiliation as opposed to religious or urban/rural characteristics. The Utah Colleges Exit Poll had 49% of Utah Trump voters saying their decision was based on a #NeverHillary position rather than any particular affinity for Trump. As someone who grew up in a household listening to Rush Limbaugh during the Clinton administration, I can testify that despising Hillary Clinton for any number of reasons is a long-standing tradition in the Republican party. But it’s hard to say if a person’s #NeverHillary position means just intense dislike or major disagreement with the direction her administration was likely to take (her pro-choice position was a deal-breaker for a lot of pro-lifers). Military people I know took very personally Hillary’s mishandling of classified information as well as everything Benghazi (just take a look at the predominantly Republican military’s reaction to Trump’s victory).
I also wonder how much party loyalty played a role. Mike Pence (Trump’s VP pick) came to Utah about two weeks before the election and urged Utah Republicans to “come home” and vote for Trump. A week after Pence’s visit, Trump’s position in Utah became much stronger.[4] Helping your party get in control of both the executive branch and, very likely, the judicial branch is not insignificant. However, if this means Utah Republicans subscribe to the notion denounced by the Deseret News that “party and the platform matter more than the character of the candidate,” that is also not insignificant. As Hawkgrrrl says, loyalty is a tricky virtue.
If many Utah Republicans voted along party lines, it may explain a lot of the apathy among Trump voters over the election results. For them it makes sense to say, “My party won, your party lost. That’s how elections work. Get over it.” The anti-Trump protests just look petulant.
I’m still trying to process the results of the election and understand the mindset of many of my friends and family members. Understanding someone’s intent does not mean I agree with their decisions or the impact of their actions, but it’s still valuable in facilitating communication and moving forward.
Epilogue
I wrote this post a couple days ago, but something happened yesterday. I was driving my mom home (remember I said I listened to a lot of Rush Limbaugh when I was growing up?), and she saw a bumper sticker on the car in front of us.
Mom: “‘Love Trumps Hate.’ I don’t get it. Is that supposed to mean something?”
Me: (Surprised and scrambling) “It’s like with all the anti-Trump protests right now. Even though he’s the president, people are saying that the racism and misogyny stuff he said isn’t okay. Remember we talked about the uptick in hate crimes?”
Mom: “Hate crimes against who?!” (In our previous conversation, all she’d heard about from her news sources was Trump supporters getting persecuted.)
Me: (Sigh) “Hate crimes against minorities. Like people throwing out racial slurs, women getting groped by strangers, Muslims getting persecuted, stuff like that.” (Aside, when I talked about the women getting groped last time, she suggested that girls needed to be more assertive and say, “Stop it!”)
Mom: “I don’t think that’s real.”
Me: “You must not be reading very many firsthand accounts.”
Mom: (Indignant) “I’ve been reading a lot of stuff!”
Me: “Fine.” (Backpedaling a bit) “You know, it’s kind of hard to say how much of an uptick there’s been, since the U.S. doesn’t really track hate crimes very well. It’s possible it’s the same amount, but people seem to be using Trump’s name with it a lot. Like painting swastikas with stuff like ‘Go Trump!’, or telling Hispanics they are going to be kicked out now that Trump’s elected. People are saying and doing all sorts of mean stuff, and saying it’s okay because Trump was elected so we don’t have to be politically correct anymore.”
Mom: (Pause) “Well, if that really is happening, that’s horrible.”
Me: “Yeah, it is.”
Discuss
[1] Of course, that politician is now being considered for Secretary of State in a Trump administration, so…
[2] Percent Trump support calculated from number of Trump votes divided by total presidential votes from that county (write-in votes are not reported on the website). County election results as of most recent report (November 18th).
[3] Carbon County and Emery County are obvious outliers for their support of Trump in relation to percent registered Republicans. This might be explained by economic factors. Over 20% of jobs in those two counties derive from coal mining and associated support industries, and Trump made a lot of campaign promises to coal miners, specifically.
[4] The FBI investigation into Hillary’s emails was in the news at the time, but Hillary’s support stayed pretty stable in Utah (31% in the earlier poll down to 28% in the later poll). Trump was pulling major support away from third-party Mormon Evan McMullin’s camp. Trump supporters were really pushing the idea that support for McMullin was equivalent to support for Clinton, so maybe the emails did play a role in Trump’s rise.
Photo from The Salt Lake Tribune.
Original data for anyone interested. Websites accessed November 21, 2016:
| County | % Trump Votes | % LDS Population | % Rural Population | % Registered Republicans |
| Beaver | 73.96% | 74.00% | 56.52% | 57.30% |
| Box Elder | 62.39% | 80.00% | 31.10% | 57.10% |
| Cache | 46.02% | 76.00% | 15.69% | 55.80% |
| Carbon | 66.28% | 49.00% | 33.71% | 28.90% |
| Daggett | 70.32% | 52.00% | 100.00% | 61.60% |
| Davis | 44.98% | 71.00% | 0.92% | 52.80% |
| Duchesne | 79.41% | 72.00% | 68.21% | 69.30% |
| Emery | 79.80% | 76.00% | 73.64% | 44.80% |
| Garfield | 68.74% | 80.00% | 100.00% | 69.40% |
| Grand | 43.40% | 29.00% | 25.39% | 30.80% |
| Iron | 65.29% | 65.00% | 22.55% | 60.70% |
| Juab | 67.69% | 80.00% | 43.47% | 54.20% |
| Kane | 64.56% | 62.00% | 54.92% | 61.80% |
| Millard | 73.75% | 82.00% | 73.94% | 64.80% |
| Morgan | 61.45% | 88.00% | 62.85% | 58.70% |
| Piute | 87.03% | 67.00% | 100.00% | 77.20% |
| Rich | 71.72% | 85.00% | 100.00% | 73.90% |
| Salt Lake | 32.96% | 56.00% | 0.90% | 37.00% |
| San Juan | 48.93% | 40.00% | 77.87% | 33.00% |
| Sanpete | 65.67% | 79.00% | 40.93% | 63.40% |
| Sevier | 77.70% | 82.00% | 64.71% | 64.00% |
| Summit | 35.56% | 37.00% | 39.20% | 32.30% |
| Tooele | 51.27% | 60.00% | 17.70% | 41.60% |
| Uintah | 76.66% | 62.00% | 46.85% | 60.60% |
| Utah | 50.81% | 83.00% | 3.33% | 57.70% |
| Wasatch | 50.45% | 71.00% | 26.85% | 51.50% |
| Washington | 68.83% | 67.00% | 15.21% | 57.80% |
| Wayne | 68.01% | 81.00% | 100.00% | 67.20% |
| Weber | 47.32% | 58.00% | 5.80% | 41.80% |

Thanks for providing the full data. When I interact the Mormon and Rural percentages, I get a better fit than with either variable by itself or with the Republican percentage by itself. In other words, being a rural Mormon or an urban non-Mormons is a better predictor of whether you voted for Trump than is whether you are registered as Republican. When I use both of those variables in a regression together, the coefficient on Mormon (.31) is higher than on Rural (.25), which implies that urban Mormons were more likely to vote for Trump than were rural non-Mormons.
I’m sure Ziff will come along eventually and do a more thorough analysis.
Excellent analysis. Thank you.
Remember though, that only 30% of the Utah electorate voted for Trump. This is the lowest number for a Republican candidate since data became generally available (State of Utah website data for registered voters and votes by candidate starts in 1960). Barry Goldwater got a higher percentage of votes, even while losing the state to LBJ in 1964. Dukakis only got 4% less of the Utah electorate to vote for him in 1988 than Trump got this year. Think about that, Trump did only marginally better than Mike Dukakis in Utah.
It turns out that the massive win for Trump was really a massive statement by Utahns that they would rather not vote at all than vote for one of two candidates they can’t abide or for a third party candidate.
Lastlemming, one of the reasons I included the full data was for people to run their own analyses, so thank-you. It’s been way too many years since I was in a stats class. Based on my experience in Salt Lake, urban non-Mormons are going to run very Democrat, so I would definitely expect them to reject Trump. The rural issue still intrigues me, though. The economic struggles of rural areas versus cities is a realistic argument to me of why Trump did so well nationally, but in Utah, ideology seems to generally play a larger role than sheer economics.
ETA: and if it’s a matter of ideology, what is it about Mormon ideology that swung a plurality towards Trump, when the initial outrage against Trump was so severe, ostensibly *because* of Mormon ideology?
From what I hear in Mormon circles among Trump voters who were ideological, it boiled down to 2 things: SCOTUS picks, and utter dislike of Hillary due to the relentless negative press she’s gotten from the right for decades (even worse than Obama, who was further to the left than the Clintons have ever been). For those who’ve been dining on a steady diet of Fox “News” for the past 20 years, Hillary was simply a non-starter. Those voters held their noses and voted for Trump anyway, assuming he would surround himself with other Republican favorites who would do the heavy lifting anyway. Some voted for McMullin, knowing it was a protest vote.
Now, under the covers, there’s good reason to believe that a blithe acceptance of sexism is a hidden motivator. Those who voted for Trump either weren’t fazed by his misogyny or were fazed but got over it. It wasn’t a deal breaker. In a highly patriarchal culture like Mormonism, we’re swimming in it already, albeit not of the p****-grabbing variety. Men are excused for a whole lot of bad behavior in cultures like Mormonism. We apparently don’t (all) disqualify for it.
SeanK, I keep hearing that numbers argument. Leaving the line blank, doing a write-in, and voting third-party are equivalent – they all represent a rejection of the two-party system generally, or the two main candidates specifically. Clinton’s support in Utah was pretty consistent. Trump’s support seems to have been working from the same pool as Evan McMullin’s support, for the most part, which meant that at the last minute, something caused a good chunk of people to suddenly embrace the dreaded two-party system again and support Trump. That’s what confuses me. What was it at the end that called them to attention? It wasn’t that Trump went to Utah that surprised me, it was the margin he won by that surprised me.
Mary Ann – that’s an interesting question, the last minute pivot to Trump. A few theories: 1) pollsters may have missed older or less tech savvy voters–I believe Clinton carried the Utah vote among younger voters although I can’t remember where I got that, 2) there’s principle and there’s practical–those who objected to Trump on principle may have pivoted back to him to block a liberal candidate and the accompanying SCOTUS picks, and 3) there was a lot of Trump voter shame. With the exception of the most out-of-touch racists and xenophobes people aren’t generally broadcasting it to the world that they voted for this asshat. They didn’t proudly vote for him, but they held their noses and did it, hoping they could keep the veneer of respectability in the process. As one of my favorite Tweets put it, Utah had better keep its mouth shut about R-rated movies after this. They lost any moral high ground they had.
Angela, there are a couple things with the sexism argument, though. One, a lot of Republicans felt it was a non-issue since Bill Clinton also had rape charges thrown at him and had affairs while in the oval office – vote a new pig into the oval office or stick an old pig in as First Husband. Democrats couldn’t hold any high ground because of sex scandals tied to Bill, Hillary’s husband, and Anthony Weiner, the husband of Hillary’s closest confidante, Huma Abedin. Two, gut instinct is to assume any negative press about your candidate is a conspiracy by the opposing candidate – the Democrats waged a smear campaign, and since they are in bed with the “liberal media,” the media was happy to oblige. Three, yes, they excused the locker room talk. My mom contended that it was just something men of a certain age said, she’d heard just as much or worse from her brother. Again, Trump’s defense that what he said in the past was tolerable because he’d heard worse from Bill Clinton on the golf course rang true to a lot of people. Heck, Giuliani and Gingrich are known adulterers as well. If you want to argue that this is “normal,” you have proof right there.
I agree about the moral high ground. Giving Utah to Evan McMullin would have made Utah look a lot cleaner (a lot of people were giving props to Utah for potentially rejecting the two main candidates out of principle). The sad thing is, Utah’s 6 electoral votes ultimately didn’t matter. They sacrificed respectability for nothing.
A few things about how the Republicans viewed the sexism angle: 1) there’s a big difference in how information about Bill Clinton’s “scandals” emerged in the 1990s vs. how information emerged about Trump in 2016. We’ve been educated by Law & Order: SVU for two decades since Bill was elected. Back then, there was confusion between consensual adultery, sexual harassment, assault, and rape, and there was no internet / 24 hour news immediacy like there is now. We didn’t have a candidate on video boasting about sexually assaulting women followed by 12 women saying “Yeah, he did that to me.” Bill Clinton didn’t say he did it, and his accusations were muddy and less reprehensible during the election. BUT . . .
2) There’s definitely a difference between how the right and the left interpret facts. Conspiracy theories about the opposition are one part of that story. Filtration by various news sources is another. And 3) there’s going to be more sexism from the right than the left simply because sexism (patriarchy) is “traditional” and feminism (anti-sexism) is “progressive.” Case in point is simply that Hillary is blamed for Bill’s behavior. Trump himself tweeted that Bill cheated because she couldn’t satisfy him. Give me a break! A party that prides itself on not being politically correct is going to engage in offensive behaviors like victim blaming and pat themselves on the back for doing so. But going back to your last point, it is extremely telling that the GOP likes to take credit for being the party of “family values” when so many of them are serial adulterers of the worst kind. I guess opposing abortion (while paying for them under the table) gets you a hall pass. I’m troubled, too, by the Anthony Weiner connection, but again, these are connections of Hillary’s. She’s not on record talking about “grabbing d***” and getting away with it because she’s famous. She doesn’t have men coming out of the woodwork claiming she assaulted them. Let’s get a modicum of perspective here. I know I’m preaching to the choir.
That exchange with your mom is telling. I’m hearing a lot of that, too. Many people live in such a one-party media bubble that they aren’t even aware of many of the news stories.
Hey lastlemming – could you do your analysis again, this time without Carbon and Emery counties (coal miners)? Curious if the strong Mormon correlation still holds.
Mary Ann, I wonder how much was a last-minute pivot to Trump versus a last-minute pivot to stay home. Polls before the election do their best to determine “likely voters” to come up with their models. When voter turn-out is that much less, it renders their model much less realistic. McMullin’s competitiveness in the pre-election polls, I think, may have been an overstatement of how many would actually make it to the polls.
How could we statistically parse out those two reactions, I wonder. I’m sure you or Ziff could find a way. 🙂
Angela, benevolent sexism is a huge part of the conservative response, I think. Men can’t control themselves, so wives have to reign them in. Not unexpected for men to stray since it’s a bigger temptation, so as long as they apologize it’s okay (Christian conservatives emphasizing how they are so awesome by forgiving Trump for his indiscretions). Obviously, women who participate in affairs are predatory skanks (Monica Lewinsky, Marla Maples). Rich and powerful men will have young, beautiful women throwing themselves at them all the time (evil temptresses), so it makes sense that those men would be more likely to fall prey to women who sinfully use their looks to get ahead (porn stars, actresses, models, pageant participants). Trump’s defense that he would have never had an affair with a journalist because, “Look at her!” fits that ideology. I couldn’t understand why those same Christian conservatives didn’t apply that same “forgiveness” rhetoric to Democrat philanderers. It’s like they consider all liberals morally corrupt no matter what (one Christian pastor did say that he trusted Trump more because he was so open about his sins, while Hillary was more suspicious because she wouldn’t admit to her sins).
I believe anyone errs who tries to tie Trump’s win in Utah to Mormon ideology. There simply is no connection. Mormons in Utah are American, and they voted like other Americans.
I also believe it us untrue, unkind, and uncharitable to say that one’s neighbor (especially a Latter-day Saint neighbor) who voted for Trump is a misogynist, homophobe, racist, or other hateful adjective. I don’t know any LDS Trump champion — those who voted for him did so with no enthusiasm. I am not and never have been a Utah resident, so I cannot speak to Utah in particular.
Clinton was not entitled to a coronation. She lost the election. She was entitled to nothing except a fair election — she was not entitled to any votes — she has to win them. Trump won fair and square. I am glad that we have fair elections in our country. To me, the process is more important than the outcome. I would rather have Trump win fair and square than have everyone how bad scrape for a Clinton coronation. In this election, with the nominees put forward by the major parties, I cannot condemn anyone for his or her choice in the booth.
I am saddened to see Clinton supporters resort to violence in the streets.
We’ll have another presidential election in four year, and a mid-term election in two years. All is well. Now, let me pray for the President-Elect and hope that he will start listening to good advice. We might be in for a rocky four years.
“I don’t know any LDS Trump champion” Unfortunately, I do know a few who were rabidly pro-Trump from the primaries onward.
As to violence in the streets, I certainly don’t condone violence. Many protests / marches were non-violent, though. I think it’s important to distinguish between them. There are two ways in which people being upset about the outcome is certainly fair: 1) there have been very real threats by crackpots using the president-elect as justification to target women and minorities, citing his more xenophobic rally commentary as justification. Standing with those groups is something many feel is important to preserve the fabric of our society, especially when some of his most vocal supporters have been extremist groups and individuals, and he has alt-right supporters in his cabinet, and 2) the popular vote was clearly for Clinton. That’s fine. That’s how the electoral college works. I’m not disputing the outcome. However, if you live on the coast, you really aren’t getting a fair shake compared to those who live in heartland states, and that’s becoming even more true as the country continues to urbanize, abandoning rural communities. People in coastal cities feel their votes don’t count, their voices aren’t heard, etc, and they are frankly right. We’re used to hearing that from the rural communities, but the fact is that rural communities get extra weight in the voting.
I know a very vocal LDS Trump supporter who actually said that if Clinton won, there would be a civil war. A real civil war with guns and Americans killing other Americans. He believed that, and he was ready to shed blood for it–he’s big on guns. Perhaps violence was going to happen either way, although I like to think that he was wrong. I am just not sure he was wrong given the individual attacks in Trump’s name that some citizens have made on Muslims, women, and other minorities since the election. What would those people have done if they had lost?
I left my Excel file at work, so any further analysis will have to wait until Monday. But I don’t recall Carbon and Emery being particular outliers, so I doubt that omitting them will make much difference.
I also know many Mormons who are proud Trump supporters including several in my own family. They dismiss his sexual predatory behavior either as outright lies, past incidents that don’t matter now, or inconsequential compared to Supreme Court picks, abortion, tax law, etc. I do think they are heavily influenced by patriarchy. One example is blaming Hillary for Bill’s sins and another is not believing or blaming the women Trump assulted.
In my ward in Australia, we have urban Trump champions, messaging that “he is a good man”, and “chosen by God”
There is also a news story saying Hilary has gone past 2 million ahead on votes, and questioning whether there should be a recount in some states http://www.msn.com/en-au/news/world/clinton-now-leads-trump-by-more-than-2-million-ballots-in-popular-vote/ar-AAkGe7P?li=AAavLaF&ocid=spartandhp
Would those who are objecting to the protests, still be accepting the verdict if it were changed?
True Blue,
Yes, if Clinton had won fair and square, there probably would have been no violence. But she didn’t.
It is being reported here that the Greens party has paid $4.5 million to have recounts in some seats which may change the outcome. Would Trump or his supporters accept that?
If Trump is President how will we feel if the MTC performs at the inauguration? I would not be impressed, but I can see supporters thinking it is a positive message
Winning “fair and square” is the key phrase. Many Trump supporters were already convinced Hillary would win, but only because the election was rigged. On the day of the election you had people in both Louisiana and Pennsylvania early on reporting machines were rigged in favor of Democrats. Then you had that Trump supporter in Iowa voting twice because she wanted to make sure her vote for Trump got counted. There would have been many political conservatives demanding recounts. Republicans don’t tend to use protests as much, so I don’t think there would have been as much violence in the streets per se since there’d be less chance of rioting/looting. You probably would have had lone gunmen/militia people do some dumb things, though (like Angela’s friend). Think Oregon militia standoff stuff. Many people felt this was a populist movement against the establishment – definitely in the same vein of feeling like true patriots/revolutionaries.
Trump winning has emboldened some serious crazies to come out of the woodwork and start intimidating people in their own communities. It’s not that difficult to imagine them going in a much more radical direction if Trump had lost by what seemed to be a small margin.